Illinois 06 23 25 14:51 PDT High School Lacrosse Ratings
Upsets Full Schedule
Explanation of:
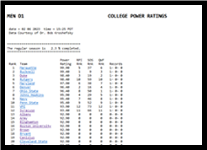 Rating Percentage Index(RPI) Rating Percentage Index(RPI)Print Version |
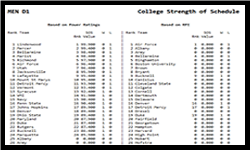 Strength Of Schedule (SOS) Strength Of Schedule (SOS)Print Version |
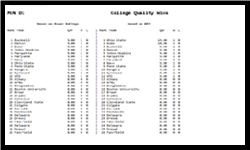 Quality Win Factor (QWF) Quality Win Factor (QWF)Print Version |
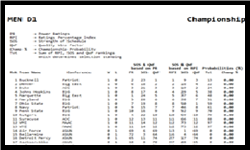 Championship ChampionshipPrint Version |
| Champ % Rank | Team | RPI | SOS | QWF | Championship % |
|---|---|---|---|---|---|
| 1 | St Viator ( 20 - 4 ) | 3 | 71 | 2 | 32 . 0 % |
| 2 | Lake Forest HS ( 24 - 2 ) | 1 | 7 | 1 | 24 . 0 % |
| 3 | New Trier ( 19 - 6 ) | 4 | 23 | 4 | 10 . 0 % |
| 4 | Loyola Academy ( 11 - 8 ) | 5 | 15 | 5 | 9 . 0 % |
| 5 | Wheaton Academy ( 19 - 5 ) | 2 | 20 | 3 | 9 . 0 % |
| 6 | Glenbard West ( 14 - 8 ) | 10 | 2 | 10 | 3 . 0 % |
| 7 | Fremd ( 15 - 6 ) | 21 | 6 | 14 | 2 . 0 % |
| 8 | Lake Zurich ( 14 - 5 ) | 6 | 3 | 7 | 2 . 0 % |
| 9 | Lyons Township ( 17 - 4 ) | 8 | 11 | 11 | 2 . 0 % |
| 10 | Neuqua Valley ( 16 - 8 ) | 12 | 4 | 16 | 2 . 0 % |
| 11 | St Ignatius Prep ( 13 - 8 ) | 16 | 5 | 15 | 2 . 0 % |
| 12 | Downers Grove ( 16 - 4 ) | 11 | 38 | 6 | 0 . 0 % |
| 13 | Hersey ( 14 - 8 ) | 34 | 85 | 35 | 0 . 0 % |
| 14 | York ( 11 - 10 ) | 13 | 1 | 18 | 0 . 0 % |
| 15 | Andrew-Sandburg-Stagg ( 14 - 6 ) | 22 | 18 | 22 | 0 . 0 % |
| 16 | Antioch ( 9 - 9 ) | 43 | 69 | 54 | 0 . 0 % |
| 17 | Barrington ( 17 - 5 ) | 14 | 27 | 8 | 0 . 0 % |
| 18 | Batavia ( 1 - 15 ) | 94 | 101 | 98 | 0 . 0 % |
| 19 | Benet Academy ( 11 - 9 ) | 27 | 12 | 41 | 0 . 0 % |
| 20 | Boylan Catholic ( 5 - 10 ) | 76 | 77 | 78 | 0 . 0 % |
| 21 | Brother Rice ( 7 - 11 ) | 75 | 78 | 82 | 0 . 0 % |
| 22 | Buffalo Grove ( 3 - 14 ) | 91 | 66 | 94 | 0 . 0 % |
| 23 | Burlington Central ( 8 - 6 ) | 58 | 84 | 45 | 0 . 0 % |
| 24 | Carmel Catholic ( 14 - 7 ) | 51 | 98 | 37 | 0 . 0 % |
| 25 | Cary Grove ( 13 - 5 ) | 26 | 43 | 27 | 0 . 0 % |
| 26 | Conant ( 10 - 11 ) | 74 | 72 | 75 | 0 . 0 % |
| 27 | Crystal Lake Central ( 10 - 8 ) | 47 | 39 | 52 | 0 . 0 % |
| 28 | Crystal Lake South ( 9 - 11 ) | 67 | 68 | 77 | 0 . 0 % |
| 29 | Deerfield ( 13 - 8 ) | 9 | 61 | 13 | 0 . 0 % |
| 30 | DePaul Prep ( 14 - 6 ) | 29 | 25 | 23 | 0 . 0 % |
| 31 | Dundee-Crown ( 3 - 14 ) | 95 | 90 | 97 | 0 . 0 % |
| 32 | Dunlap ( 4 - 8 ) | 83 | 95 | 65 | 0 . 0 % |
| 33 | Elk Grove ( 1 - 14 ) | 102 | 91 | 101 | 0 . 0 % |
| 34 | Evanston Township ( 9 - 7 ) | 23 | 17 | 25 | 0 . 0 % |
| 35 | Fenwick ( 8 - 12 ) | 66 | 94 | 80 | 0 . 0 % |
| 36 | Geneva ( 8 - 10 ) | 60 | 36 | 66 | 0 . 0 % |
| 37 | Glenbard North ( 7 - 10 ) | 65 | 50 | 69 | 0 . 0 % |
| 38 | Glenbrook North ( 16 - 5 ) | 7 | 19 | 9 | 0 . 0 % |
| 39 | Glenbrook South ( 5 - 13 ) | 44 | 14 | 70 | 0 . 0 % |
| 40 | Grant Community ( 13 - 5 ) | 41 | 52 | 32 | 0 . 0 % |
| 41 | Grayslake Co-op ( 11 - 6 ) | 39 | 56 | 34 | 0 . 0 % |
| 42 | Hampshire ( 12 - 10 ) | 53 | 29 | 60 | 0 . 0 % |
| 43 | Highland Park ( 9 - 8 ) | 59 | 53 | 46 | 0 . 0 % |
| 44 | Hinsdale Central ( 15 - 7 ) | 18 | 9 | 21 | 0 . 0 % |
| 45 | Hoffman Estates ( 9 - 11 ) | 77 | 74 | 79 | 0 . 0 % |
| 46 | Homewood Flossmoor ( 1 - 17 ) | 99 | 80 | 104 | 0 . 0 % |
| 47 | Huntley ( 17 - 4 ) | 15 | 10 | 12 | 0 . 0 % |
| 48 | Immaculate Conception ( 2 - 14 ) | 98 | 93 | 99 | 0 . 0 % |
| 49 | Jacobs ( 5 - 14 ) | 85 | 76 | 90 | 0 . 0 % |
| 50 | Kaneland ( 7 - 9 ) | 81 | 89 | 71 | 0 . 0 % |
| 51 | Kenwood ( 3 - 10 ) | 97 | 96 | 81 | 0 . 0 % |
| 52 | Lake Forest Academy ( 7 - 7 ) | 70 | 92 | 57 | 0 . 0 % |
| 53 | Lake Park ( 3 - 14 ) | 96 | 88 | 96 | 0 . 0 % |
| 54 | Lakes Community ( 11 - 8 ) | 37 | 35 | 50 | 0 . 0 % |
| 55 | Lane Tech ( 9 - 8 ) | 46 | 57 | 49 | 0 . 0 % |
| 56 | Latin School ( 6 - 14 ) | 82 | 70 | 93 | 0 . 0 % |
| 57 | Lemont ( 9 - 8 ) | 50 | 34 | 53 | 0 . 0 % |
| 58 | Libertyville ( 13 - 7 ) | 17 | 60 | 19 | 0 . 0 % |
| 59 | Lincoln Park ( 7 - 5 ) | 84 | 102 | 42 | 0 . 0 % |
| 60 | Lincoln-Way ( 13 - 6 ) | 28 | 37 | 33 | 0 . 0 % |
| 61 | Lockport Township ( 12 - 7 ) | 54 | 51 | 43 | 0 . 0 % |
| 62 | Maine South ( 10 - 10 ) | 30 | 13 | 38 | 0 . 0 % |
| 63 | Marian Central Catholic ( 0 - 0 ) | 0 | 0 | 0 | 0 . 0 % |
| 64 | Marist ( 9 - 8 ) | 24 | 8 | 36 | 0 . 0 % |
| 65 | Marmion Academy ( 3 - 13 ) | 90 | 64 | 87 | 0 . 0 % |
| 66 | McHenry ( 8 - 10 ) | 63 | 62 | 74 | 0 . 0 % |
| 67 | Minooka ( 3 - 16 ) | 87 | 54 | 102 | 0 . 0 % |
| 68 | Montini Catholic ( 10 - 5 ) | 45 | 59 | 31 | 0 . 0 % |
| 69 | Mount Carmel ( 13 - 5 ) | 25 | 30 | 24 | 0 . 0 % |
| 70 | Mundelein ( 2 - 14 ) | 80 | 31 | 89 | 0 . 0 % |
| 71 | Naperville Central ( 8 - 10 ) | 57 | 97 | 59 | 0 . 0 % |
| 72 | Naperville North ( 6 - 9 ) | 35 | 21 | 55 | 0 . 0 % |
| 73 | Nazareth Academy ( 6 - 13 ) | 86 | 58 | 85 | 0 . 0 % |
| 74 | Normal Community ( 5 - 8 ) | 73 | 82 | 61 | 0 . 0 % |
| 75 | Northside College Prep ( 1 - 8 ) | 104 | 103 | 72 | 0 . 0 % |
| 76 | Notre Dame ( 5 - 15 ) | 78 | 49 | 91 | 0 . 0 % |
| 77 | Oak Forest ( 12 - 7 ) | 49 | 48 | 47 | 0 . 0 % |
| 78 | Oak Park-River Forest ( 7 - 11 ) | 56 | 28 | 67 | 0 . 0 % |
| 79 | Palatine ( 3 - 14 ) | 79 | 40 | 95 | 0 . 0 % |
| 80 | Plainfield North ( 4 - 12 ) | 89 | 83 | 86 | 0 . 0 % |
| 81 | Prairie Ridge ( 7 - 12 ) | 64 | 42 | 83 | 0 . 0 % |
| 82 | Prospect ( 11 - 8 ) | 61 | 63 | 56 | 0 . 0 % |
| 83 | Providence Catholic ( 6 - 8 ) | 69 | 79 | 62 | 0 . 0 % |
| 84 | Riverside Brookfield ( 11 - 7 ) | 52 | 65 | 44 | 0 . 0 % |
| 85 | Rolling Meadows ( 9 - 10 ) | 68 | 67 | 73 | 0 . 0 % |
| 86 | Schaumburg ( 14 - 6 ) | 36 | 32 | 28 | 0 . 0 % |
| 87 | South Elgin ( 12 - 8 ) | 32 | 24 | 39 | 0 . 0 % |
| 88 | St Charles East ( 14 - 3 ) | 20 | 44 | 17 | 0 . 0 % |
| 89 | St Charles North ( 12 - 5 ) | 33 | 46 | 26 | 0 . 0 % |
| 90 | St Francis ( 12 - 6 ) | 40 | 55 | 40 | 0 . 0 % |
| 91 | St Laurence ( 2 - 13 ) | 93 | 81 | 92 | 0 . 0 % |
| 92 | St Patrick ( 1 - 20 ) | 101 | 87 | 103 | 0 . 0 % |
| 93 | St Rita ( 8 - 12 ) | 38 | 22 | 76 | 0 . 0 % |
| 94 | Stevenson ( 10 - 9 ) | 31 | 73 | 29 | 0 . 0 % |
| 95 | Taft HS ( 8 - 9 ) | 88 | 99 | 68 | 0 . 0 % |
| 96 | Timothy Christian ( 1 - 7 ) | 103 | 104 | 63 | 0 . 0 % |
| 97 | Vernon Hills ( 6 - 14 ) | 71 | 41 | 84 | 0 . 0 % |
| 98 | Warren Township ( 11 - 10 ) | 19 | 45 | 30 | 0 . 0 % |
| 99 | Washington ( 9 - 8 ) | 55 | 47 | 58 | 0 . 0 % |
| 100 | Waubonsie-Metea Co-Op ( 5 - 14 ) | 62 | 33 | 88 | 0 . 0 % |
| 101 | Wauconda ( 1 - 14 ) | 92 | 75 | 100 | 0 . 0 % |
| 102 | Wheaton North ( 7 - 11 ) | 48 | 16 | 64 | 0 . 0 % |
| 103 | Wheaton South ( 10 - 8 ) | 42 | 26 | 48 | 0 . 0 % |
| 104 | Wheeling ( 2 - 18 ) | 100 | 86 | 105 | 0 . 0 % |
| 105 | Whitney Young ( 5 - 6 ) | 72 | 100 | 51 | 0 . 0 % |