PA East 05 28 26 08:03 PDT High School Lacrosse Ratings
Upsets Full Schedule
Explanation of:
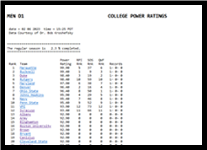 Rating Percentage Index(RPI) Rating Percentage Index(RPI)Print Version |
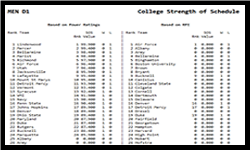 Strength Of Schedule (SOS) Strength Of Schedule (SOS)Print Version |
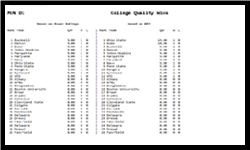 Quality Win Factor (QWF) Quality Win Factor (QWF)Print Version |
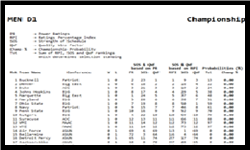 Championship ChampionshipPrint Version |
| Champ % Rank | Team | RPI | SOS | QWF | Championship % |
|---|---|---|---|---|---|
| 1 | La Salle College ( 18 - 3 ) | 6 | 61 | 5 | 37 . 77 % |
| 2 | Springfield-Delco ( 19 - 2 ) | 1 | 28 | 1 | 17 . 77 % |
| 3 | Downingtown West ( 20 - 2 ) | 4 | 16 | 3 | 9 . 99 % |
| 4 | Ridley ( 19 - 3 ) | 3 | 2 | 2 | 9 . 99 % |
| 5 | Radnor ( 17 - 5 ) | 2 | 43 | 4 | 7 . 77 % |
| 6 | Bayard Rustin ( 15 - 4 ) | 8 | 63 | 8 | 5 . 55 % |
| 7 | St Josephs Prep ( 16 - 5 ) | 9 | 23 | 7 | 3 . 33 % |
| 8 | Garnet Valley ( 12 - 8 ) | 14 | 25 | 18 | 2 . 22 % |
| 9 | Avon Grove ( 13 - 7 ) | 22 | 52 | 19 | 1 . 11 % |
| 10 | Easton Area ( 18 - 3 ) | 7 | 45 | 10 | 1 . 11 % |
| 11 | Marple Newtown ( 14 - 6 ) | 15 | 51 | 13 | 1 . 11 % |
| 12 | Pennridge ( 11 - 5 ) | 21 | 13 | 29 | 1 . 11 % |
| 13 | Spring-Ford ( 17 - 5 ) | 5 | 12 | 6 | 1 . 11 % |
| 14 | Abington ( 8 - 8 ) | 46 | 34 | 64 | 0 . 0 % |
| 15 | Allentown Central Cathol( 15 - 5 ) | 11 | 70 | 12 | 0 . 0 % |
| 16 | Archbishop Carroll ( 9 - 10 ) | 64 | 89 | 60 | 0 . 0 % |
| 17 | Archbishop Ryan ( 7 - 10 ) | 62 | 24 | 73 | 0 . 0 % |
| 18 | Archbishop Wood ( 3 - 13 ) | 80 | 41 | 88 | 0 . 0 % |
| 19 | Avon Grove Charter ( 1 - 11 ) | 95 | 92 | 53 | 0 . 0 % |
| 20 | Bethlehem Catholic ( 0 - 14 ) | 87 | 33 | 94 | 0 . 0 % |
| 21 | Bishop Shanahan ( 14 - 4 ) | 28 | 58 | 23 | 0 . 0 % |
| 22 | BL Charter ( 0 - 2 ) | 74 | 48 | 37 | 0 . 0 % |
| 23 | Bonner-Prendergast ( 0 - 14 ) | 89 | 78 | 92 | 0 . 0 % |
| 24 | Boyertown ( 8 - 9 ) | 52 | 56 | 65 | 0 . 0 % |
| 25 | Cardinal OHara ( 18 - 3 ) | 26 | 73 | 9 | 0 . 0 % |
| 26 | Central Bucks East ( 9 - 11 ) | 33 | 20 | 66 | 0 . 0 % |
| 27 | Central Bucks South ( 8 - 10 ) | 47 | 26 | 69 | 0 . 0 % |
| 28 | Central Bucks West ( 9 - 7 ) | 27 | 10 | 43 | 0 . 0 % |
| 29 | Central Philadelphia ( 6 - 4 ) | 36 | 69 | 38 | 0 . 0 % |
| 30 | Cheltenham ( 0 - 13 ) | 90 | 76 | 83 | 0 . 0 % |
| 31 | Church Farm School ( 5 - 5 ) | 93 | 93 | 15 | 0 . 0 % |
| 32 | Coatesville ( 5 - 13 ) | 65 | 19 | 85 | 0 . 0 % |
| 33 | Conestoga ( 9 - 8 ) | 16 | 4 | 36 | 0 . 0 % |
| 34 | Conwell Egan ( 3 - 13 ) | 84 | 66 | 86 | 0 . 0 % |
| 35 | Council Rock North ( 11 - 6 ) | 30 | 38 | 49 | 0 . 0 % |
| 36 | Council Rock South ( 13 - 6 ) | 20 | 29 | 31 | 0 . 0 % |
| 37 | Devon Prep ( 10 - 11 ) | 32 | 6 | 51 | 0 . 0 % |
| 38 | Downingtown East ( 14 - 8 ) | 13 | 1 | 24 | 0 . 0 % |
| 39 | Emmaus ( 10 - 10 ) | 41 | 77 | 56 | 0 . 0 % |
| 40 | Father Judge ( 13 - 6 ) | 40 | 30 | 41 | 0 . 0 % |
| 41 | Frankford ( 5 - 2 ) | 23 | 65 | 28 | 0 . 0 % |
| 42 | Freedom Bethlehem ( 7 - 10 ) | 57 | 49 | 61 | 0 . 0 % |
| 43 | George Washington ( 0 - 1 ) | 68 | 35 | 32 | 0 . 0 % |
| 44 | Great Valley ( 6 - 12 ) | 63 | 42 | 80 | 0 . 0 % |
| 45 | Harriton ( 5 - 13 ) | 55 | 22 | 67 | 0 . 0 % |
| 46 | Hatboro-Horsham ( 11 - 8 ) | 51 | 87 | 52 | 0 . 0 % |
| 47 | Haverford HS ( 10 - 9 ) | 29 | 3 | 42 | 0 . 0 % |
| 48 | Holy Ghost Prep ( 9 - 8 ) | 58 | 75 | 58 | 0 . 0 % |
| 49 | Interboro ( 0 - 0 ) | 0 | 0 | 0 | 0 . 0 % |
| 50 | Kennett ( 7 - 11 ) | 53 | 14 | 74 | 0 . 0 % |
| 51 | Lansdale Catholic ( 6 - 14 ) | 60 | 79 | 77 | 0 . 0 % |
| 52 | Liberty Bethlehem ( 3 - 14 ) | 85 | 62 | 90 | 0 . 0 % |
| 53 | Lower Merion ( 3 - 15 ) | 61 | 8 | 84 | 0 . 0 % |
| 54 | Masterman ( 8 - 3 ) | 50 | 90 | 25 | 0 . 0 % |
| 55 | Mastery Charter North - ( 0 - 0 ) | 0 | 0 | 0 | 0 . 0 % |
| 56 | Methacton ( 7 - 9 ) | 59 | 39 | 62 | 0 . 0 % |
| 57 | Moravian Academy ( 12 - 7 ) | 35 | 9 | 44 | 0 . 0 % |
| 58 | Nazareth Area ( 12 - 8 ) | 37 | 40 | 54 | 0 . 0 % |
| 59 | Neshaminy ( 4 - 14 ) | 73 | 47 | 95 | 0 . 0 % |
| 60 | New Hope-Solebury ( 7 - 10 ) | 76 | 67 | 76 | 0 . 0 % |
| 61 | North Penn ( 2 - 16 ) | 72 | 32 | 97 | 0 . 0 % |
| 62 | Northampton Area ( 9 - 10 ) | 56 | 55 | 72 | 0 . 0 % |
| 63 | Northeast ( 0 - 4 ) | 75 | 50 | 50 | 0 . 0 % |
| 64 | Northwestern Lehigh ( 12 - 7 ) | 34 | 17 | 47 | 0 . 0 % |
| 65 | Olney Charter ( 5 - 4 ) | 12 | 27 | 39 | 0 . 0 % |
| 66 | Owen J Roberts ( 7 - 10 ) | 48 | 82 | 46 | 0 . 0 % |
| 67 | Oxford Area ( 2 - 13 ) | 82 | 60 | 89 | 0 . 0 % |
| 68 | Parkland ( 14 - 6 ) | 17 | 68 | 16 | 0 . 0 % |
| 69 | Penncrest ( 14 - 6 ) | 18 | 37 | 14 | 0 . 0 % |
| 70 | Pennsbury ( 7 - 9 ) | 38 | 46 | 48 | 0 . 0 % |
| 71 | Perkiomen Valley ( 16 - 8 ) | 10 | 5 | 11 | 0 . 0 % |
| 72 | Phoenixville ( 1 - 17 ) | 92 | 85 | 96 | 0 . 0 % |
| 73 | Pleasant Valley ( 5 - 11 ) | 67 | 71 | 79 | 0 . 0 % |
| 74 | Plymouth-Whitemarsh ( 11 - 8 ) | 42 | 31 | 59 | 0 . 0 % |
| 75 | Pope John Paul II ( 6 - 10 ) | 71 | 86 | 75 | 0 . 0 % |
| 76 | Pottsgrove ( 5 - 11 ) | 83 | 88 | 71 | 0 . 0 % |
| 77 | Quakertown ( 2 - 16 ) | 88 | 54 | 98 | 0 . 0 % |
| 78 | Roman Catholic ( 1 - 11 ) | 86 | 59 | 82 | 0 . 0 % |
| 79 | Saucon Valley ( 4 - 14 ) | 78 | 57 | 93 | 0 . 0 % |
| 80 | Solanco ( 4 - 4 ) | 94 | 96 | 17 | 0 . 0 % |
| 81 | Souderton ( 12 - 8 ) | 25 | 7 | 40 | 0 . 0 % |
| 82 | South Philadelphia ( 0 - 3 ) | 81 | 64 | 45 | 0 . 0 % |
| 83 | Southern Lehigh ( 10 - 9 ) | 44 | 44 | 63 | 0 . 0 % |
| 84 | Springfield Twp ( 6 - 11 ) | 79 | 91 | 78 | 0 . 0 % |
| 85 | Strath Haven ( 9 - 11 ) | 39 | 18 | 57 | 0 . 0 % |
| 86 | Sun Valley ( 5 - 12 ) | 66 | 21 | 81 | 0 . 0 % |
| 87 | Truman ( 0 - 0 ) | 0 | 0 | 0 | 0 . 0 % |
| 88 | Unionville ( 6 - 12 ) | 49 | 53 | 70 | 0 . 0 % |
| 89 | Upper Darby ( 0 - 15 ) | 77 | 11 | 91 | 0 . 0 % |
| 90 | Upper Dublin ( 13 - 7 ) | 19 | 74 | 30 | 0 . 0 % |
| 91 | Upper Merion ( 4 - 14 ) | 91 | 83 | 87 | 0 . 0 % |
| 92 | Upper Moreland ( 10 - 9 ) | 70 | 72 | 68 | 0 . 0 % |
| 93 | West Chester East ( 11 - 8 ) | 45 | 80 | 55 | 0 . 0 % |
| 94 | West Chester Henderson ( 15 - 7 ) | 24 | 15 | 26 | 0 . 0 % |
| 95 | West Philadelphia ( 0 - 1 ) | 69 | 36 | 33 | 0 . 0 % |
| 96 | William Tennent ( 1 - 1 ) | 54 | 98 | 34 | 0 . 0 % |
| 97 | Wissahickon ( 13 - 5 ) | 31 | 81 | 27 | 0 . 0 % |
| 98 | Delaware Valley ( 11 - 8 ) | 43 | 84 | 35 | 0 . 0 % |