PA West 05 28 26 08:03 PDT High School Lacrosse Ratings
Upsets Full Schedule
Explanation of:
 Rating Percentage Index(RPI) Rating Percentage Index(RPI)Print Version |
 Strength Of Schedule (SOS) Strength Of Schedule (SOS)Print Version |
 Quality Win Factor (QWF) Quality Win Factor (QWF)Print Version |
 Championship ChampionshipPrint Version |
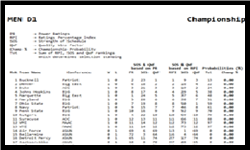
| Champ % Rank | Team | RPI | SOS | QWF | Championship % |
|---|---|---|---|---|---|
| 1 | Mount Lebanon ( 17 - 2 ) | 1 | 13 | 1 | 31 . 11 % |
| 2 | Shady Side Academy ( 13 - 7 ) | 2 | 10 | 4 | 31 . 11 % |
| 3 | Fox Chapel ( 15 - 4 ) | 4 | 1 | 3 | 8 . 88 % |
| 4 | Hampton ( 16 - 5 ) | 3 | 9 | 2 | 7 . 77 % |
| 5 | North Allegheny ( 9 - 9 ) | 8 | 4 | 10 | 6 . 66 % |
| 6 | Pine Richland ( 12 - 8 ) | 5 | 3 | 7 | 5 . 55 % |
| 7 | Upper St Clair ( 8 - 9 ) | 11 | 2 | 13 | 3 . 33 % |
| 8 | Mars Area ( 15 - 5 ) | 6 | 21 | 5 | 2 . 22 % |
| 9 | Seneca Valley ( 8 - 8 ) | 19 | 14 | 22 | 2 . 22 % |
| 10 | Peters Township ( 15 - 5 ) | 7 | 5 | 6 | 1 . 11 % |
| 11 | Baldwin ( 7 - 10 ) | 36 | 27 | 36 | 0 . 0 % |
| 12 | Bethel Park ( 12 - 7 ) | 14 | 17 | 14 | 0 . 0 % |
| 13 | Butler Area ( 7 - 9 ) | 21 | 23 | 21 | 0 . 0 % |
| 14 | Canon-McMillan ( 13 - 5 ) | 12 | 6 | 9 | 0 . 0 % |
| 15 | Cathedral Prep ( 9 - 7 ) | 9 | 33 | 12 | 0 . 0 % |
| 16 | Central Catholic ( 4 - 13 ) | 26 | 8 | 38 | 0 . 0 % |
| 17 | Chartiers Valley ( 10 - 8 ) | 20 | 12 | 23 | 0 . 0 % |
| 18 | Conneaut ( 0 - 0 ) | 0 | 0 | 0 | 0 . 0 % |
| 19 | Erie-McDowell ( 5 - 10 ) | 31 | 39 | 25 | 0 . 0 % |
| 20 | Fairview ( 5 - 10 ) | 32 | 31 | 27 | 0 . 0 % |
| 21 | Franklin Regional ( 7 - 9 ) | 30 | 28 | 34 | 0 . 0 % |
| 22 | Freeport Area ( 7 - 9 ) | 27 | 25 | 31 | 0 . 0 % |
| 23 | Gateway ( 0 - 12 ) | 42 | 30 | 44 | 0 . 0 % |
| 24 | Greensburg Central Catho( 0 - 0 ) | 0 | 0 | 0 | 0 . 0 % |
| 25 | Hempfield Greensburg ( 7 - 9 ) | 24 | 16 | 28 | 0 . 0 % |
| 26 | Hickory ( 14 - 2 ) | 13 | 43 | 11 | 0 . 0 % |
| 27 | Indiana Area ( 11 - 6 ) | 16 | 26 | 19 | 0 . 0 % |
| 28 | Knoch ( 5 - 11 ) | 34 | 40 | 40 | 0 . 0 % |
| 29 | Latrobe ( 10 - 8 ) | 23 | 20 | 24 | 0 . 0 % |
| 30 | Meadville-Crawford Cty ( 1 - 7 ) | 35 | 32 | 32 | 0 . 0 % |
| 31 | Moon Area ( 5 - 12 ) | 28 | 11 | 39 | 0 . 0 % |
| 32 | North Catholic ( 7 - 8 ) | 29 | 29 | 29 | 0 . 0 % |
| 33 | North Hills ( 2 - 14 ) | 38 | 19 | 41 | 0 . 0 % |
| 34 | Norwin ( 5 - 8 ) | 25 | 34 | 30 | 0 . 0 % |
| 35 | Penn-Trafford ( 9 - 10 ) | 22 | 7 | 26 | 0 . 0 % |
| 36 | Plum ( 9 - 8 ) | 37 | 42 | 33 | 0 . 0 % |
| 37 | Quaker Valley ( 9 - 5 ) | 17 | 18 | 18 | 0 . 0 % |
| 38 | Seton LaSalle ( 2 - 13 ) | 40 | 36 | 42 | 0 . 0 % |
| 39 | Sewickley Academy ( 11 - 6 ) | 15 | 38 | 15 | 0 . 0 % |
| 40 | Shaler Area ( 10 - 6 ) | 18 | 15 | 20 | 0 . 0 % |
| 41 | South Fayette ( 16 - 5 ) | 10 | 22 | 8 | 0 . 0 % |
| 42 | Taylor Allderdice ( 2 - 12 ) | 41 | 35 | 43 | 0 . 0 % |
| 43 | Trinity Area ( 5 - 9 ) | 33 | 24 | 35 | 0 . 0 % |
| 44 | West Allegheny ( 4 - 14 ) | 43 | 41 | 45 | 0 . 0 % |
| 45 | Winchester Thurston ( 4 - 11 ) | 39 | 37 | 37 | 0 . 0 % |