NY CLass C 05 28 26 08:11 PDT High School Lacrosse Ratings
Upsets Full Schedule
Explanation of:
 Rating Percentage Index(RPI) Rating Percentage Index(RPI)Print Version |
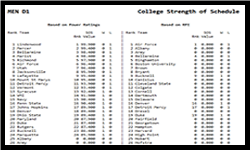 Strength Of Schedule (SOS) Strength Of Schedule (SOS)Print Version |
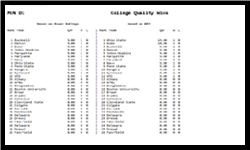 Quality Win Factor (QWF) Quality Win Factor (QWF)Print Version |
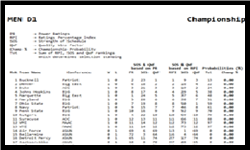 Championship ChampionshipPrint Version |
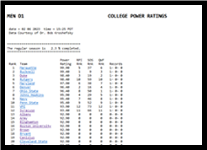
| Champ % Rank | Team | RPI | SOS | QWF | Championship % |
|---|